Using Heatmaps to Optimize Product Page Layouts
I. Introduction
In the world of e-commerce, heatmaps are powerful tools that visually represent user interactions on product pages. They provide insights into how customers engage with various elements, making them crucial for any business aiming to enhance conversion rates. By employing heatmaps, businesses can significantly improve the user experience, leading to more informed design decisions and ultimately higher sales.
For instance, tools like Plerdy offer AI-powered website optimization capabilities that leverage heatmaps to track user behavior, analyze clicks, and enhance conversions. This software helps businesses reduce bounce rates, boost user engagement, and fine-tune website elements for improved performance across platforms like Shopify and WordPress.

II. What are Heatmap Analytics?
A. Types of Heatmaps
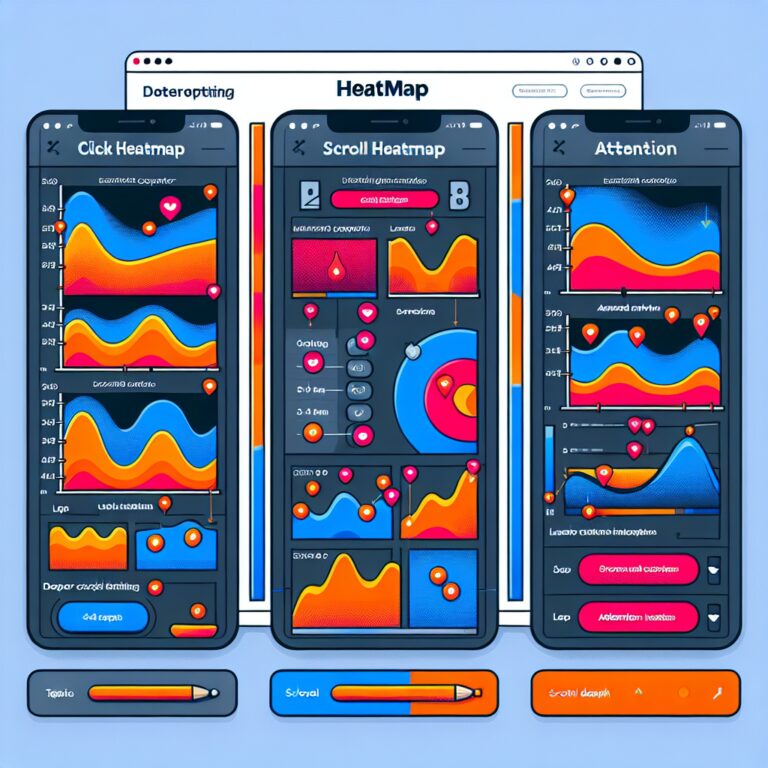
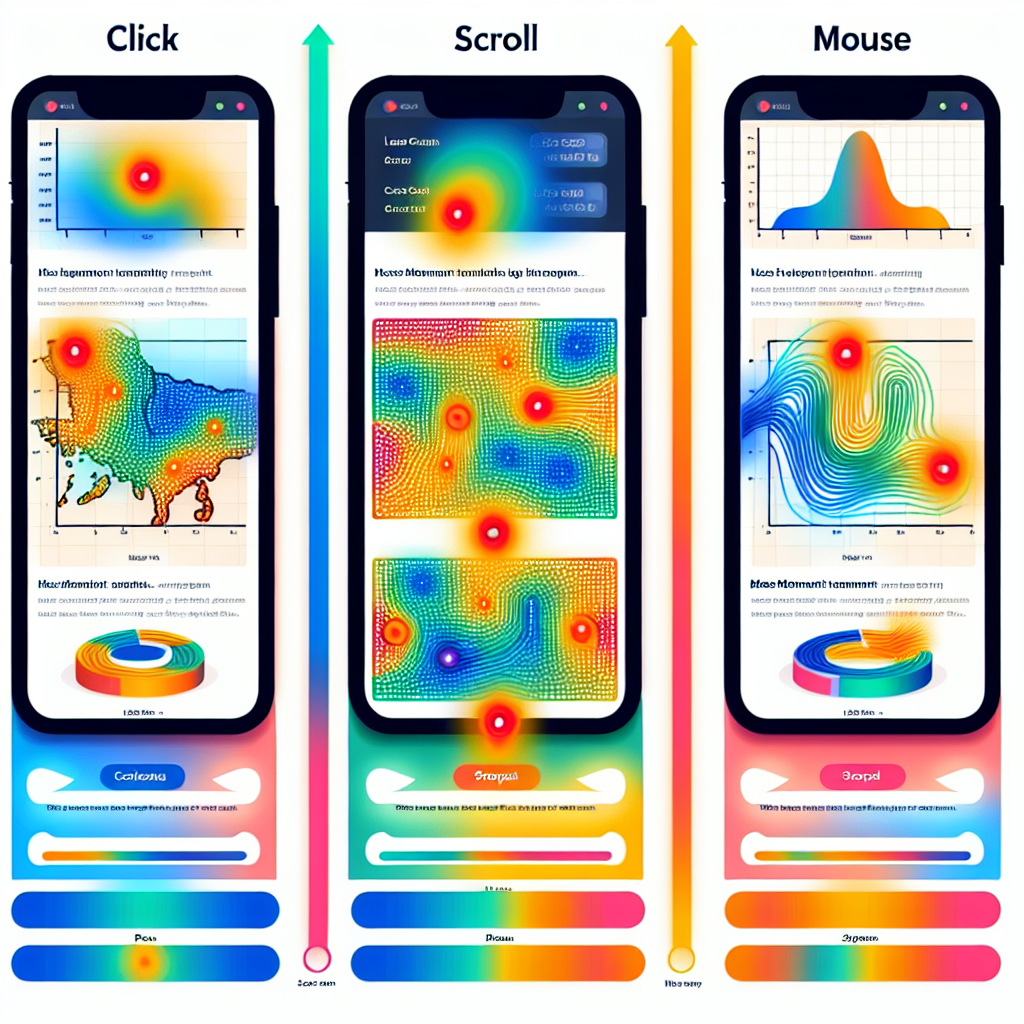
There are several types of heatmaps that offer unique perspectives on user engagement. Click heatmaps reveal where users are clicking most frequently, highlighting the most popular areas on a product page. Scroll heatmaps show how far down a page users typically scroll, indicating whether vital information is being overlooked. Additionally, mouse movement heatmaps track users’ cursor movements, offering valuable insights into attention and engagement.
B. How Heatmaps Collect and Display Data
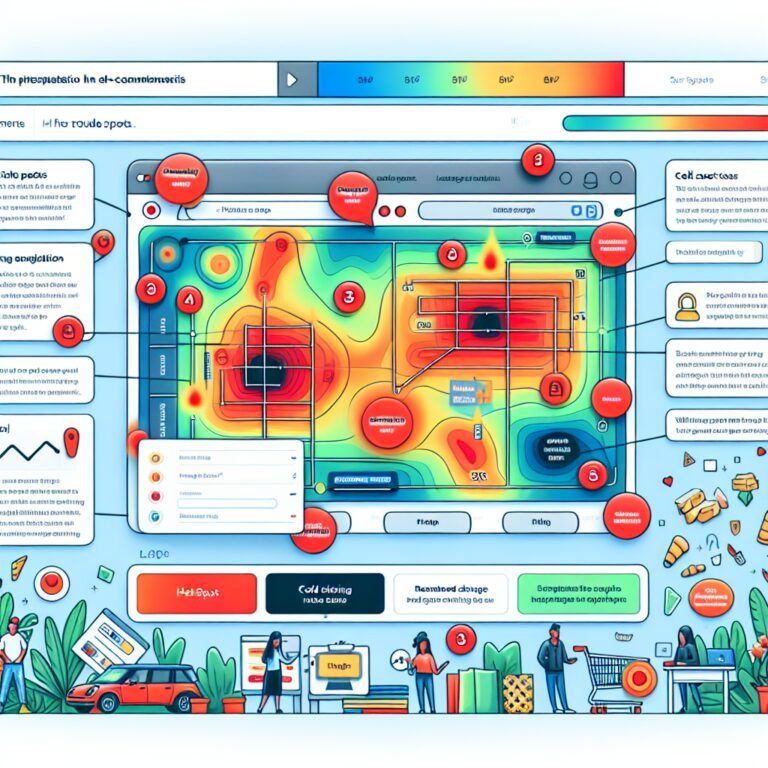
Heatmaps work by collecting data through user interactions, translating them into visual representations through color coding. The intensity of color indicates the level of engagement, helping businesses quickly identify areas of interest or neglect. This graphical data allows for easier interpretation compared to traditional analytics.
C. Brief Discussion on Tools Available for Heatmap Analytics
Numerous tools on the market provide heatmap analytics, each with its features and pricing models. Among them, Plerdy stands out as a prime choice, equipped to help businesses understand and visualize user behavior with exceptional insights. Choosing the right tool depends on specific business needs and budget considerations.
III. Understanding User Behavior through Heatmaps
A. Analyzing User Interactions
Heatmaps enable businesses to analyze user interactions systematically, revealing what attracts attention and what doesn’t. By closely monitoring these interactions, organizations can adapt their strategies to align with actual user behavior. This analysis can indicate whether users are effectively navigating the product page or struggling to find important information.
B. Identifying Trends and Patterns in Product Page Engagement
Heatmaps don’t just provide snapshots; they reveal trends over time. For example, certain times of day may show heightened engagement, allowing businesses to time marketing efforts optimally. By identifying patterns in user behavior, brands can tailor their product pages to match customer expectations.
C. Common User Behaviors to Look For
When interpreting heatmaps, several behaviors can signal areas needing attention. High clicks in specific areas can suggest effective design elements, while low engagement areas may need redesign or reconsideration. Additionally, significant scroll drop-off points indicate where users lose interest, prompting a review of content placement.
IV. Key Elements of Product Pages to Monitor with Heatmaps
A. Product Images and Galleries
Product images are pivotal as they often serve as the first point of interaction for users. Heatmap analytics can show which images are most engaging and whether users prefer to view galleries over individual images. By optimizing image placement and quality, businesses can boost user engagement.
B. Product Descriptions and Specifications
The effectiveness of product descriptions directly impacts purchasing decisions. Heatmaps can reveal whether users read the entire description or skip it, signaling content quality issues. By enhancing the readability and positioning of these descriptions, brands can increase conversion rates.
C. Call-to-Action Buttons
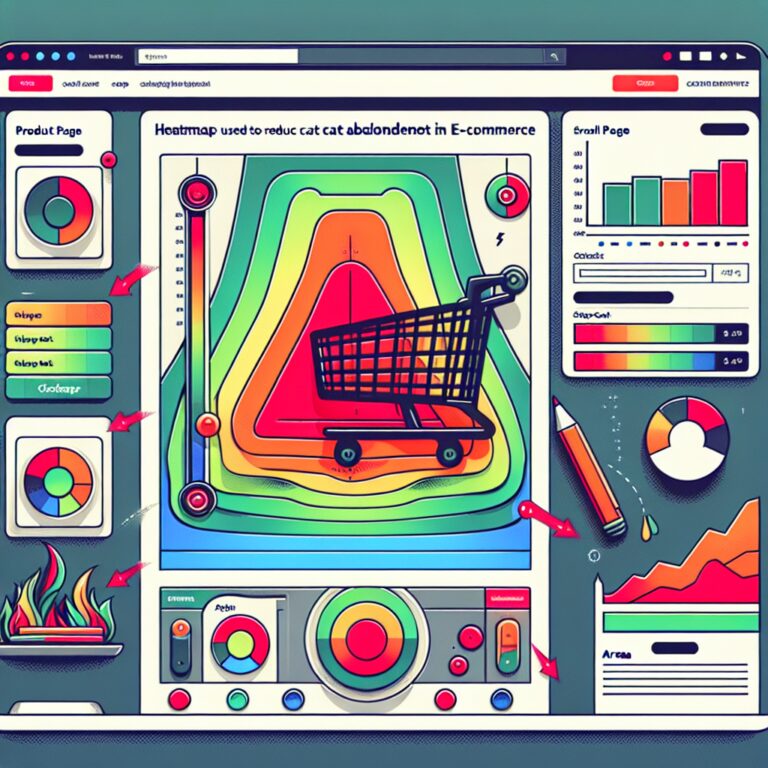
Call-to-action buttons like “Add to Cart” are essential for conversions. Monitoring their performance through heatmaps can show if they grab users’ attention and how often they are clicked. Adjusting button size, color, and placement can lead to more effective user engagement.
D. Price Display and Promotional Offers
Price points and discounts are critical factors in consumer decision-making. Heatmaps help assess if users are engaging with these key elements. Altering the visibility and arrangement of pricing information can enhance perceived value and urgency in making a purchase.
E. Customer Reviews and Ratings
Social proof is a powerful influencer in e-commerce. Understanding how users interact with customer reviews can help businesses position them effectively. Heatmap data can indicate whether reviews have the desired impact or need to be showcased more prominently.
V. Interpreting Heatmap Data
A. Understanding the Color Coding
The effectiveness of heatmap data lies in its color coding, which serves as a visual cue for user engagement levels. Warmer colors like red indicate high interaction, while cooler colors such as blue show less engagement. This color distinction helps quickly identify areas that may require adjustments.
B. Extracting Actionable Insights from Heatmap Data
Businesses can glean actionable insights from heatmap analysis by focusing on both high and low engagement areas. For instance, enhancing content in low-interaction zones may boost overall user experience. Regular review of this data can inform continuous product page evolution.
C. Case Studies or Examples of Successful Optimizations
Successful businesses illustrate the power of heatmap analytics. For example, a leading online retailer found that moving their “Add to Cart” button up on the product page increased conversion rates by 15%. These real-world applications underscore the effectiveness of using heatmaps for optimization.
VI. Strategies to Optimize Product Page Layouts Using Heatmaps
A. Rearranging Elements Based on User Attention
Utilizing heatmap data helps businesses strategically rearrange page elements to capture user attention effectively. By prioritizing the placement of critical components like CTAs and product images, companies can create more user-centric layouts. This thoughtful rearrangement often leads to improved conversion rates.
B. A/B Testing Different Layouts
A/B testing allows businesses to compare different product page layouts to identify what resonates best with users. By leveraging insights from heatmaps, companies can make informed decisions about which layout performs better. This iterative process ensures that product pages evolve to meet user needs efficiently.
C. Enhancing Visual Hierarchy
Creating a clear visual hierarchy makes it easier for users to navigate product pages. Heatmaps can guide adjustments that emphasize the most important elements, guiding users naturally through the page. A well-structured layout can significantly improve user engagement and conversion rates.
D. Improving Mobile Responsiveness
With a growing number of users accessing e-commerce sites via mobile devices, it’s vital to enhance mobile responsiveness. Heatmap feedback reveals distinct behaviors between mobile and desktop users, helping businesses adapt layouts accordingly. Tailoring experiences for different devices can prevent potential losses in mobile conversions.
VII. Common Pitfalls to Avoid
A. Misinterpreting Heatmap Data
One common mistake is misinterpreting heatmap data, leading to misguided decisions. Businesses should ensure they consider context when analyzing engagement levels. Without a thoughtful approach to data interpretation, optimization efforts may fall short of their goals.
B. Making Changes Without Proper Analysis
Implementing changes without thorough analysis of heatmap data can be detrimental. It’s critical to understand the reasons behind user behavior before making modifications. A well-informed strategy will yield better results compared to reactive changes.
C. Ignoring Mobile User Behavior
Neglecting mobile user behavior can result in missed opportunities, as many consumers shop via their smartphones. Heatmaps should be analyzed separately for mobile devices to ensure layouts cater to this audience. Ignoring mobile insights could seriously impact overall performance.
VIII. Continuous Improvement and Tracking
A. Importance of Regular Analysis of Heatmap Data
Regularly analyzing heatmap data is essential for maintaining optimal product page performance. User behavior can shift over time, requiring businesses to adapt their strategies accordingly. Continuous tracking ensures that pages remain aligned with evolving customer preferences.
B. Setting Up Benchmarks for Product Page Performance
Establishing benchmarks helps evaluate product page effectiveness more accurately. These benchmarks can be based on historical data, providing context for current performance. Using this framework allows businesses to identify successful strategies and further areas of improvement.
C. Adapting to Changing User Behaviors Over Time
Users’ preferences and behaviors can change, necessitating adaptive strategies. By consistently monitoring heatmap analytics, businesses can respond swiftly to shifts, maintaining relevance in a competitive landscape. This adaptability can lead to sustained engagement and increased conversions.
IX. Conclusion
Utilizing heatmaps for product page optimization is a game-changer for e-commerce businesses aiming to enhance user experience and bolster conversions. By providing actionable insights and allowing for continuous improvement, heatmaps guide informed decision-making. Implementing heatmap analytics can empower businesses to create more effective, user-friendly product pages that drive sales. Moreover, learning more about Plerdy can open further opportunities for leveraging heatmaps to their fullest potential.