Understanding Scroll Heatmaps: Are Users Seeing Your CTA?

I. Introduction
Scroll heatmaps are visual representations that track how users interact with your web pages, illustrating how far down they scroll. For e-commerce businesses, understanding user engagement is crucial to achieving sales success and ensuring that your call-to-action (CTA) buttons are effectively positioned to drive conversions. This article will delve into the mechanics of scroll heatmaps, the significance of CTAs in e-commerce, methods for analyzing user behavior, and how to optimize your site based on heatmap insights.
Plerdy is an innovative tool that leverages AI to optimize websites by tracking user behavior through heatmaps. It provides data-driven insights to enhance conversions, reduce bounce rates, and improve user engagement. Plerdy supports diverse platforms such as Shopify, WordPress, and Magento, making it a versatile solution for e-commerce businesses.
II. What Are Scroll Heatmaps?
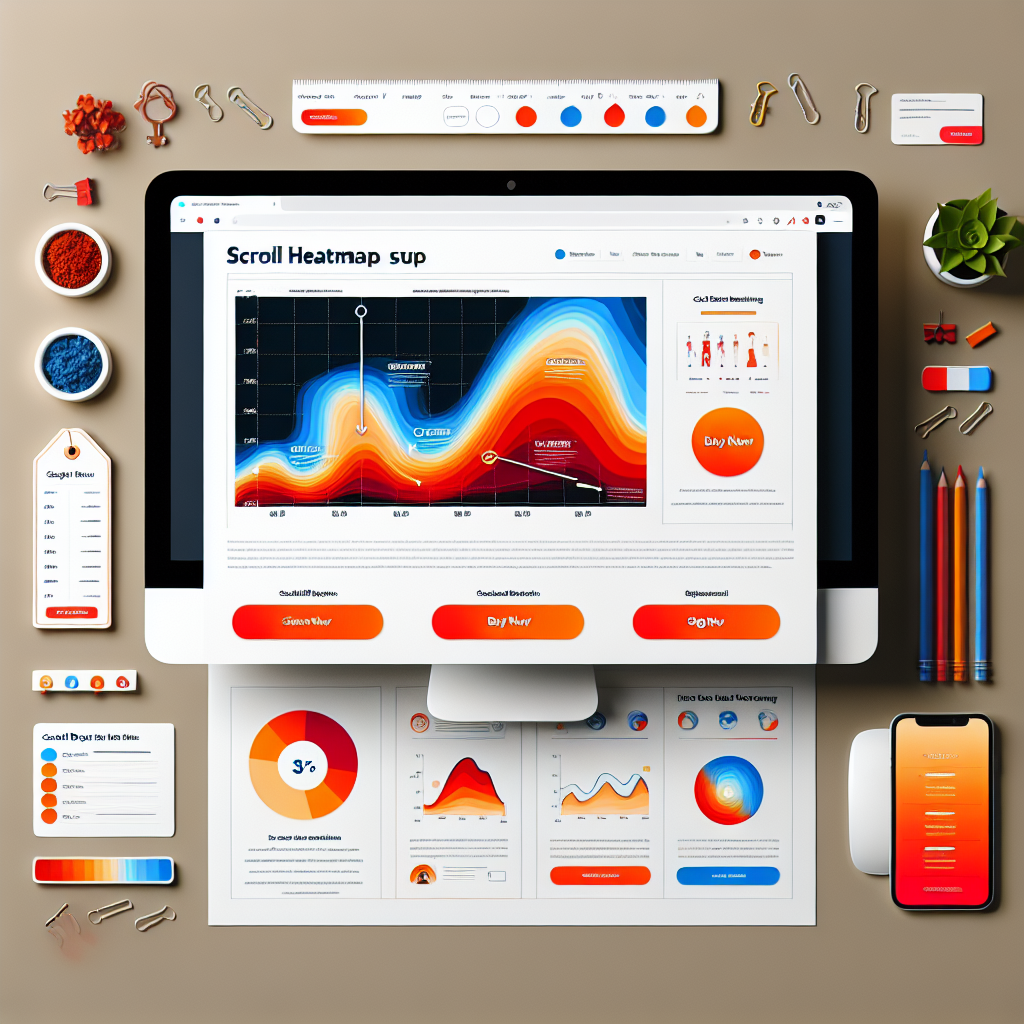
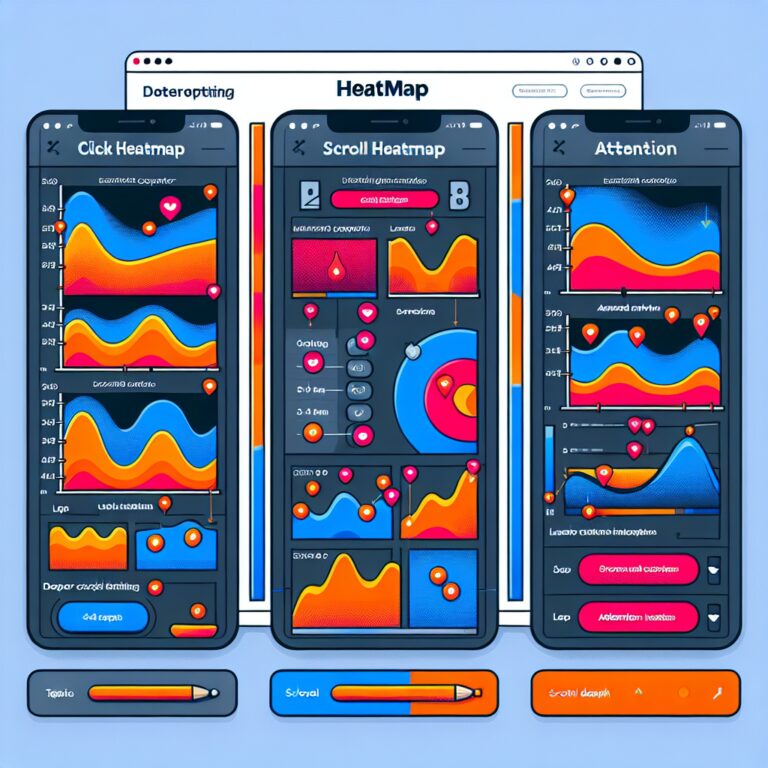
Scroll heatmaps visualize user scrolling behavior by displaying varying colors that indicate how much of a page users have viewed. Unlike click heatmaps, which show where users click on a page, scroll heatmaps focus on the depth of user engagement, providing insight into whether visitors are seeing important content, including CTAs. Numerous tools available for generating scroll heatmaps can help users gain valuable insights about their web pages. Among these tools, Plerdy stands out for its comprehensive features.
III. The Role of CTAs in E-commerce
A call-to-action (CTA) is a prompt that encourages users to take a specific action, such as “Buy Now” or “Sign Up for Our Newsletter.” CTAs play a vital role in guiding the buyer’s journey, serving as crucial touchpoints that can significantly impact conversion rates. However, many e-commerce websites make common mistakes, such as poor wording, unclear visibility, or ineffective placement of CTAs, ultimately leading to lost opportunities for engagement and sales.
IV. Analyzing Scroll Heatmaps
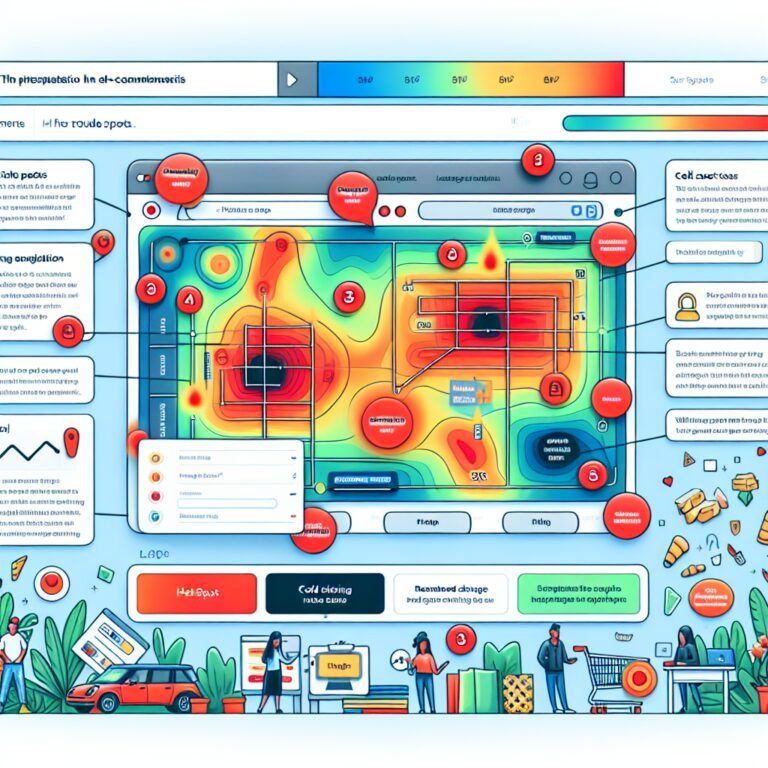
Interpreting scroll heatmaps involves understanding the visual data represented by color coding, with warmer colors typically indicating high engagement and cooler colors suggesting areas that users have neglected. Key metrics to focus on include scroll depth, which measures how far users scroll down the page, and engagement percentages that highlight the proportion of users who reach essential content. By thoroughly analyzing these metrics, businesses can identify which sections of their web pages capture attention and which areas may require optimization.
V. Are Users Seeing Your CTAs?
To determine if users are seeing your CTAs, it’s vital to assess their placement relative to scroll depth. For instance, if a prominent CTA is placed too far down the page, it may be missed by a large percentage of visitors. Correlating the data from scroll heatmaps with conversion rates can provide clear insights, and case studies show that implementing strategic improvements in visibility often leads to significant increases in conversions.
VI. Optimizing Your E-commerce Site Using Scroll Heatmaps
Enhancing the visibility of CTAs based on scroll heatmap insights can involve several strategies, including repositioning buttons to more visible locations and optimizing their design for better appeal. A/B testing different versions of CTAs can further refine their effectiveness, allowing businesses to assess which variations resonate best with their audience. Additionally, ensuring your e-commerce site is responsive and user-friendly across both mobile and desktop devices is essential for maximizing user engagement and promoting effective CTAs. You can explore more about optimizing product page layouts with heatmaps here.
VII. Best Practices for Using Scroll Heatmaps
Regularly analyzing and updating your web pages based on evolving user behavior is crucial for maintaining engagement and conversion rates. Combining scroll heatmap data with other analytics tools, such as user session recordings and conversion funnels, can yield comprehensive insights into visitor interactions. Encouraging user feedback is also beneficial, as it complements heatmap data and helps businesses understand the underlying reasons for user behaviors and preferences. Learn more about analyzing checkout process drop-offs here.
Conclusion
In summary, scroll heatmaps serve as an invaluable tool for e-commerce websites seeking to enhance their user engagement and optimize conversion rates. By understanding how to effectively leverage scroll heatmaps, businesses can ensure that their CTAs are visible and strategically placed within the buyer’s journey. It’s time for you to implement heatmap analysis on your e-commerce site to unlock insights that drive sales and improve user experience. To continue your learning journey, consider exploring more about Plerdy and similar tools that can further support your business goals.


