Best Practices for Using Heatmaps in Shopify and WooCommerce

I. Introduction
Heatmaps in e-commerce are visual representations of data that illustrate where users click, scroll, and move on a website. For Shopify and WooCommerce store owners, leveraging heatmap analytics is crucial for understanding customer interactions and making data-driven decisions. An exceptional tool that stands out in this domain is Plerdy, which leverages AI to provide businesses with comprehensive insights into user behavior, helping reduce bounce rates and enhance user engagement across platforms like Shopify, WordPress, and Magento.
This article will explore the various types of heatmaps, their benefits, best practices for implementation, practical applications, common pitfalls, and real-world case studies.

II. Understanding Heatmaps
A. Types of Heatmaps
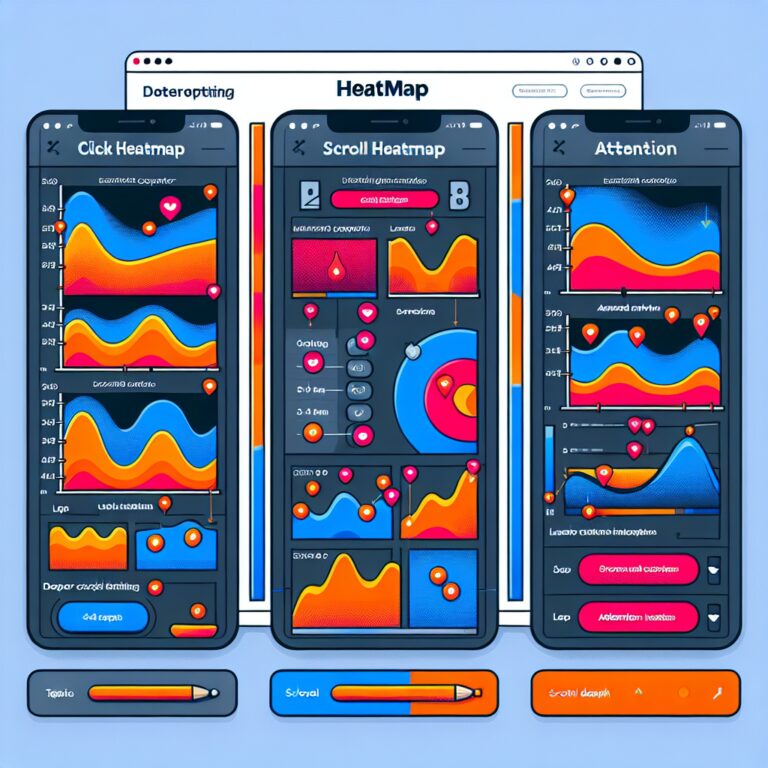
There are several types of heatmaps that can provide valuable insights into user behavior:
- Click Heatmaps: These show where users click on a webpage, highlighting the most popular and least engaged areas.
- Scroll Heatmaps: These indicate how far down a page users scroll, revealing which content captures attention and which is ignored.
- Move Heatmaps: These track the movement of the mouse cursor, helping businesses understand how users navigate and interact with page elements.
B. How Heatmaps Work
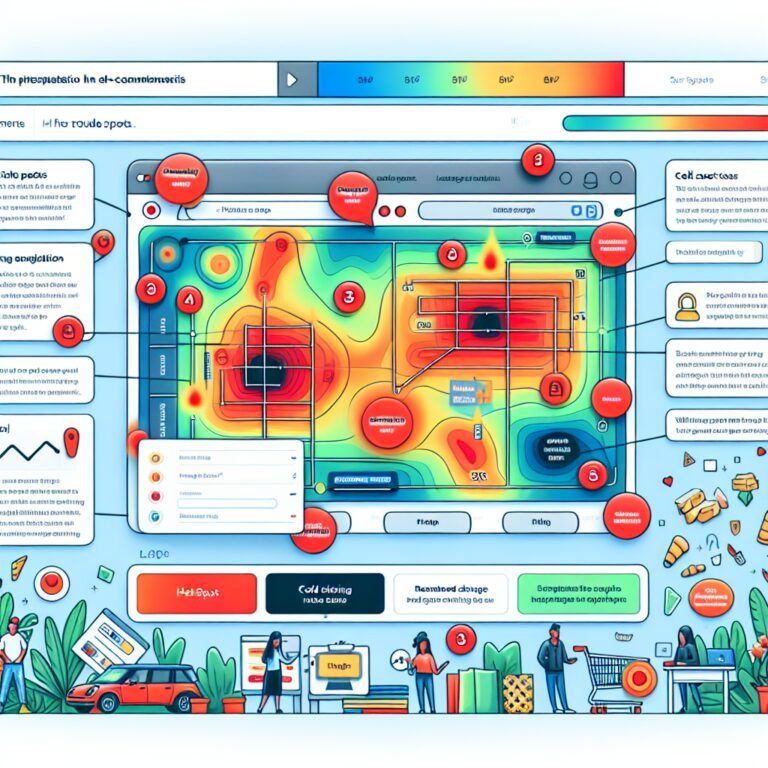
Heatmaps operate by collecting data on user actions and displaying this information in a color-coded format. Warmer colors represent higher engagement, while cooler colors indicate less interaction. This visual data helps store owners identify areas that require attention or optimization.
C. Key Metrics Tracked by Heatmaps
Key metrics tracked by heatmaps include click frequency, scroll depth, and mouse movement patterns. Understanding these metrics can uncover user preferences and pain points, guiding adjustments to enhance user experience and drive conversions.
III. Benefits of Using Heatmaps for E-commerce
A. Enhancing User Experience
Using heatmaps can significantly enhance user experience by providing insights into how visitors interact with your website. By identifying elements that engage customers and those that do not, you can make informed design modifications. Smoother navigation and streamlined layout contribute to a more satisfying experience for your users.
B. Identifying Conversion Rate Optimization Opportunities
Heatmaps allow you to identify areas on your site that may hinder conversion rates. By analyzing user behavior, you can find barriers to purchases and address these pain points effectively. As a result, potential sales can be turned into actual conversions, maximizing your revenue potential.
C. Understanding Customer Behavior and Preferences
Heatmaps capture user behavior in real-time, offering an invaluable glimpse into customer preferences. This understanding enables store owners to tailor their offerings and marketing strategies. Ultimately, aligning your e-commerce approach with user behaviors leads to increased loyalty and improved sales figures.
D. Improving Website Design and Layout
Website design and layout play significant roles in user engagement. Using heatmap data, you can assess the effectiveness of your current design and identify opportunities for improvements. Explore more here.
IV. Best Practices for Implementing Heatmaps
A. Choosing the Right Heatmap Tool
Selecting the appropriate heatmap tool is essential for effective implementation. While options like Crazy Egg and Hotjar exist, Plerdy remains a top choice for its robust, AI-driven features tailored for Shopify and WooCommerce. Consider choosing Plerdy, which aligns with your specific needs and budget.
B. Setting Up Heatmaps Effectively
Proper setup is critical for gaining accurate insights from heatmap analytics. This includes configuring tracking options and ensuring the correct pages are monitored. Additionally, defining clear goals and objectives for analysis will help you make sense of the data collected and drive actionable insights. For guidance on analyzing checkout process drop-offs with heatmaps, see this article.
C. Analyzing Heatmap Data
After collecting heatmap data, the analysis phase begins. Identifying patterns and trends within the data allows store owners to pinpoint which elements resonate with users and which do not. Furthermore, segmenting data can provide deeper insights into various demographics and behaviors, enabling tailored strategies.
V. Practical Applications of Heatmap Insights
A. Optimizing Product Pages
Heatmap insights can guide the optimization of product pages for better performance. By analyzing the layout and product placements, businesses can enhance visibility for high-converting products. Additionally, improving the positioning of CTAs and buttons based on user interaction can significantly increase engagement. See how other stores succeeded here.
B. Refining Checkout Processes
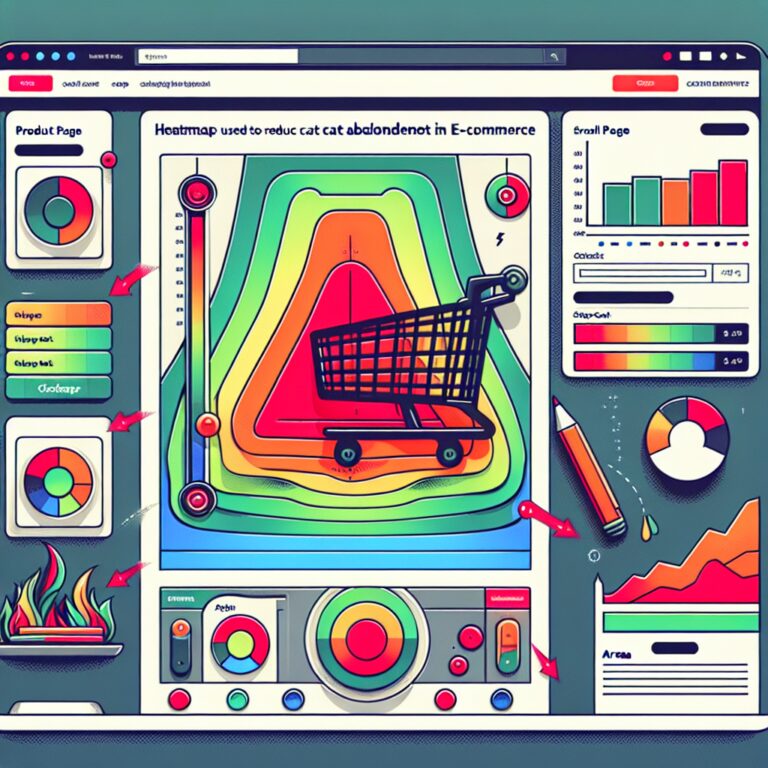
Streamlining the checkout process is crucial for reducing cart abandonment rates. Using heatmaps to identify friction points allows you to simplify navigation and improve the overall experience. Read more about how heatmaps can reduce cart abandonment in this article.
C. Tailoring Marketing Strategies
Heatmaps can inform marketing strategies by revealing how users interact with promotions and advertisements. Adjusting marketing efforts based on user interactions can lead to more effective campaigns. Personalizing user experiences based on heatmap insights fosters a stronger connection with customers, leading to higher conversion rates. For further reading about improving productivity, consider looking at Best AI Tools for Productivity.
VI. Common Mistakes to Avoid
A. Misinterpreting Heatmap Data
One of the most common pitfalls is misinterpreting heatmap data. Relying solely on visual representations without considering context can lead to erroneous conclusions. It’s crucial to combine heatmap analysis with other data sources to form a comprehensive understanding of user behavior.
B. Relying Solely on Heatmaps Without Other Analytics
While heatmaps provide valuable insights, they should not be the only tool in your analytics toolbox. Without incorporating other analytic methods, such as Google Analytics, you may miss critical information. A multi-faceted approach to data analysis ensures well-rounded decision-making.
C. Overlooking Mobile User Behavior
With the increasing prevalence of mobile commerce, overlooking mobile user behavior can lead to missed opportunities. Heatmap analysis should include a focus on mobile users, as their interaction patterns differ significantly from desktop users. Tailoring your approach to mobile-specific insights will enhance user experience across all devices.
VII. Case Studies
A. Successful Implementation Examples
Several e-commerce brands have successfully implemented heatmaps to optimize their websites. For instance, a Shopify store that improved its product page layout based on heatmap analysis saw a significant increase in conversion rates, illustrating the potential of targeted adjustments.
B. Lessons Learned from Heatmap Analytics
Learning from real-world implementations, it’s clear that heatmaps can directly impact decision-making. For instance, an online retailer noted a reduction in cart abandonment after refining their checkout process based on heatmap insights. These lessons highlight the importance of continually analyzing and adjusting strategies based on user behavior.
VIII. Conclusion
Heatmaps are a powerful tool for e-commerce optimization, offering valuable insights into user behavior, preferences, and engagement. By incorporating heatmaps into your analytics strategy, you can make data-driven decisions that will enhance the user experience, improve conversion rates, and ultimately grow your business. Embracing heatmap technology, particularly through platforms like Plerdy, will position your Shopify or WooCommerce store for long-term success in the competitive e-commerce landscape.